Start with the text the model actually sees
The experience starts with tokenization. A tokenizer divides text into tokens and maps them to IDs. Models do not read words exactly as people see them; punctuation, uncommon words, and multilingual text can split in surprising ways. Showing the token sequence gives users a concrete view of what enters the model.
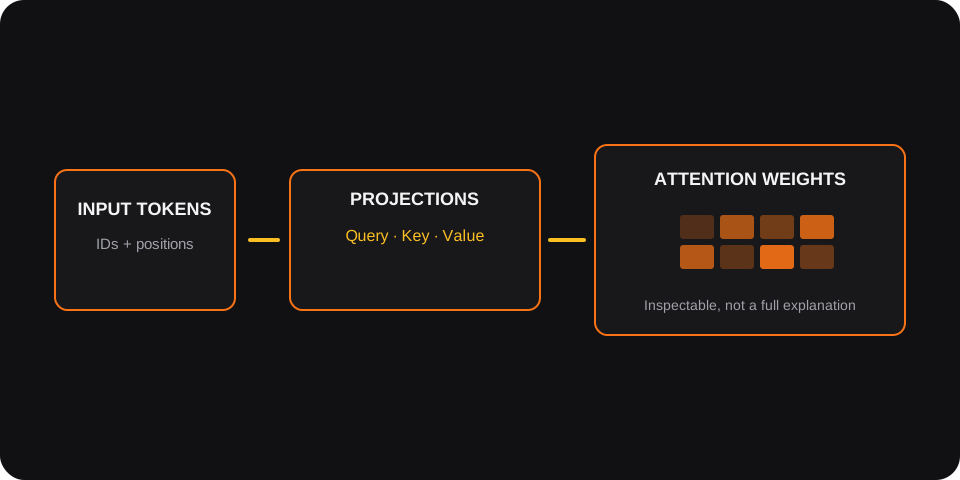
For a given layer and attention head, the model transforms token representations into Queries, Keys, and Values. Attention scores come from Query–Key compatibility, scaled by the key dimension, and passed through a softmax. The weights determine how much each position contributes through the Value vectors.
Connect the visual layers
A heatmap can make relationships inspectable: rows and columns correspond to token positions, and cell intensity reflects an attention weight. But a heatmap is easy to render and easy to misread. Users need to know which layer and head they are viewing, whether a causal mask is in effect, and how token positions map to the input.
Showing QKV transformations alongside attention weights helps bridge abstract operations and visible patterns. The project combines a Python/model-oriented stack with an interactive visualization layer, including PyTorch, Hugging Face Transformers, and React Three Fiber.
Interpretability needs honest boundaries
An attention weight is evidence about one computation in one layer and head; it is not, by itself, a complete explanation of why a model answered as it did. Treating a bright cell as a definitive explanation would overstate what the display can show.
AttentionLens is most useful as an exploratory instrument: a way to ask sharper questions, compare patterns, and build intuition about model structure. A useful interface keeps the input, tokenization, selected head, and output view connected, and helps users move from “this cell is bright” to “what changes when I compare another head or input?”
The goal is not to make a Transformer look magical—or to claim a heatmap makes it fully transparent. It is to make one important mechanism less opaque. When people can inspect the pieces, they can form better questions about the whole.
Build a visualization that stays faithful to the model
The hardest implementation detail is often alignment. Tokenizers may add special tokens, split a visible word into several pieces, or return offsets that need careful mapping back to the original string. The display should preserve that mapping and make special tokens legible rather than hiding them in a way that changes the apparent sequence.
Attention values also need correct context. A causal mask prevents a decoder position from attending to future positions; padding masks suppress positions that do not represent input. If the interface omits a mask or mixes heads and layers, its matrix can look convincing while describing the wrong computation.
Performance affects interpretation too. Large heatmaps become difficult to read and expensive to render. A responsive interface can virtualize token labels, limit the visible sequence length with a clear notice, and let the user inspect one layer and head at a time instead of rendering every tensor simultaneously.
The impact is better questions, not a magic explanation
A strong learning interaction begins with a question: what changes when a negation is introduced, when a name is moved, or when a different head is selected? Comparing controlled inputs helps learners notice patterns without mistaking coincidence for a rule.
A useful next step is to pair attention inspection with other evidence—such as ablation experiments or feature-level analysis—while keeping each method's limits explicit. The interface can encourage those follow-up questions, but it should not collapse distinct interpretability methods into one authoritative score.
AttentionLens is valuable when it helps a student or engineer move from passive curiosity to a testable hypothesis. The display is a window into selected operations, not a complete map of model cognition. That distinction makes the project more credible, not less ambitious.
Follow one token through Q, K, and V
After token IDs are embedded and combined with positional information, a layer projects each hidden state into three learned views. Queries represent what a position is seeking, keys represent what positions expose for matching, and values carry the information that is mixed into the result. These are useful intuitions, not literal descriptions of a model's intent.
For one head, the familiar operation is Attention(Q, K, V) = softmax((QKᵀ) / √dₖ + M)V. The dot product produces compatibility scores; scaling controls their magnitude; an optional mask M removes invalid positions; softmax turns scores into weights; and the weighted values produce a new representation. Multiple heads perform this with different learned projections before their outputs are combined.
A good inspection surface makes the dimensions explicit. If an input has sequence length n, model width d, and h heads, each head commonly works at width d/h. Showing the tensor shape next to the selected layer prevents a two-dimensional heatmap from hiding the batch, head, and token axes that gave rise to it.
scores = (query @ key.transpose(-2, -1)) / math.sqrt(key.size(-1))
if attention_mask is not None:
    scores = scores.masked_fill(attention_mask == 0, float("-inf"))
weights = torch.softmax(scores, dim=-1)
context = weights @ value
Build a visual trace that stays aligned
The visual pipeline begins before the heatmap. The tokenizer can add special tokens, split a single visible word into multiple pieces, and return offsets into the source string. If the interface labels a token using only its raw ID, a learner cannot tell which characters it came from; if it merges subword pieces without explaining the merge, it can imply a computation the model did not perform.
AttentionLens should keep a stable mapping from each displayed token to its token index and source span. Selecting a token can then highlight the corresponding row, while selecting a destination highlights a column. The same selection should identify the active layer and head in every panel so the user can move from text to scores to the resulting weighted context without losing state.
Masks are not decoration. A causal mask blocks future positions in decoder self-attention; a padding mask excludes filler positions. The rendering should distinguish a true zero weight from a cell that was masked before softmax. Otherwise, the visualization can look plausible while teaching the wrong operation.
Use interaction to test hypotheses, not declare explanations
A useful lesson is comparative. Start with a short sentence, change one token, and inspect whether a particular head's pattern changes. Then repeat the experiment with another layer or head. Controlled inputs make it easier to notice patterns; they still do not prove that a highlighted relation caused the model's final output.
Attention is one internal signal among many. It can be informative about token mixing, but it is not a universal explanation of model behavior. To investigate a stronger causal claim, a learner may need interventions such as ablation, activation patching, or comparison with other attribution methods. AttentionLens should make those boundaries part of the interaction rather than hiding them in a disclaimer.
For performance, avoid rendering every head and every token at once. Let people choose a layer and head, cap the sequence length with a visible notice, and keep labels readable at mobile sizes. An inspector that faithfully shows one operation is more valuable than a dense dashboard that implies completeness but cannot be read.
| View | What it helps inspect | What it does not establish |
|---|---|---|
| Token alignment | Which token IDs correspond to input spans | Why the model selected its final answer |
| Attention weights | How a selected head distributes attention | A complete causal explanation of behavior |
| Q/K/V projections | How hidden states enter an attention operation | A human-readable semantic role for every dimension |
Separate model work from interactive rendering
An inspector has two different workloads: producing model outputs and letting a person explore them. Keep those responsibilities decoupled. A model adapter can return a compact response containing token IDs, token offsets, selected-layer attention values, and shape metadata; the presentation layer can then render the chosen view without loading full tensors into a browser. This boundary also makes it easier to compare another model or tokenizer later.
Attention tensors can be large even for modest sequences. If a request returns every layer, head, and token pair, memory use grows quickly and the visualization becomes overwhelming. Let the user choose a layer and head, cap long inputs with an explicit message, and cache only the expensive results that are safe to reuse. If the model runs remotely, expose inference latency and failure states rather than leaving a heatmap panel blank.
Interactive details should reinforce the same index mapping everywhere: hover or keyboard focus on a token should highlight its row; selecting a destination should reveal the corresponding column; the head and layer should remain visible in the panel title. Provide a non-color cue for selected and masked cells so the chart remains understandable to people who cannot distinguish the palette.
Validate the visualization against known computations
Before asking whether a heatmap is insightful, ask whether it is correct. Use a tiny synthetic sequence where attention masks and shapes can be checked by hand. Compare extracted tensors with the model library's returned attention values for the same input, model revision, evaluation mode, and tokenizer. Small floating-point differences can be expected across devices, but axes, token order, and masking behavior should agree.
A useful test suite checks invariants: each unmasked attention row sums approximately to one after softmax; masked positions contribute no probability; the number of rendered token labels matches the tokenizer output; and changing the selected head updates the data, not just the heading. Snapshot tests help catch layout drift, while numerical tests catch a more dangerous class of errors that still produces a polished image.
Finally, make the limits visible in the product itself. Show the model and tokenizer identifiers, selected layer and head, and whether the view represents pre- or post-dropout attention. Keep an explanation close to the chart: the visualization exposes a computation, not a complete account of reasoning. This combination of provenance, numerical validation, and honest framing gives learners a surface they can question rather than merely admire.
Loading comments…